- JDK vs JRE vs JVM
- JVM - Java Virtual Machine
- JMM - Java Memory Model
- Java Garbage Collection
- Escaping references
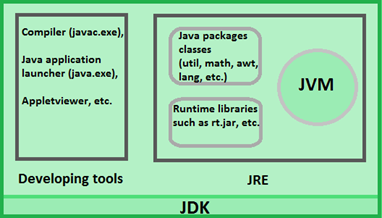
JDK vs JRE vs JVM
- JVM
- virtual machine that run the Java bytecodes.
- Class loader system + runtime data area + Execution Engine
- JRE
- Environment where Java programs runs.
- [JVM + Java Packages Classes (util, math, lang etc) + runtime libraries]
- JDK
- JRE + Development/debugging tools
- (Java compiler javac in its /bin) and tools (ex. javaDoc, debugger)
- For running Java programs on browser/computer you will only install JRE, for development JDK is required.
- If you are deploying a WebApp with JSP, JDK is required as JSP is converted into Servlets by compilation.
| Components | |
|---|---|
| Compiler | Translate human readable source code in to computer-executable machine code. |
| Interpreter | Translates the instructions into an intermediate form, which it then executes. |
| Linker | Combines object modules to form an executable program, done by the linker. Linking function calls. |
| Loader | Copies programs from a storage device to the main memory, where they can be executed. |
JVM - Java Virtual Machine
- Java virtual machine (JVM)
- abstract computing machine to run a Java program.
JVM Notions
- Specification - documented requirement of JVM implementation to ensure inter-operability.
- Implementation - computer program that meets the requirements of the JVM specification.
- Instance - an implementation running in a process that executes a computer program compiled into bytecode.
What JVM does?
- Loads, Verifies, execute code and Provides runtime environment.
JVM provides definitions for
- Memory area, Class file format, Register set, Garbage-collected heap, Fatal error report etc.
Architecture
TODO : Read full article here.

| JVM Components | |
|---|---|
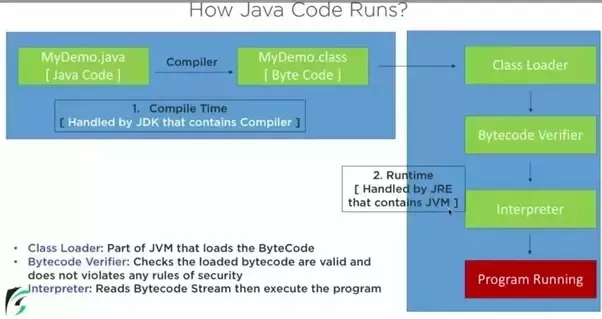
| Classloader | used to load class files. |
| Class (Method) Area | stores per-class structure. (runtime constant pool, field and method data, code for methods) |
| Heap | runtime data area where objects are allocated. |
| Stack | stores call frames (local variables, partial results, method invocation and return). |
| Program Counter Register | PC (program counter) register, Address of JVM instruction currently being executed. |
| Native Method Stack | contains all the native methods used in the application |
| Execution Engine | A virtual processor Interpreter: Read bytecode stream then execute the instructions. Just-In-Time (JIT) compiler |
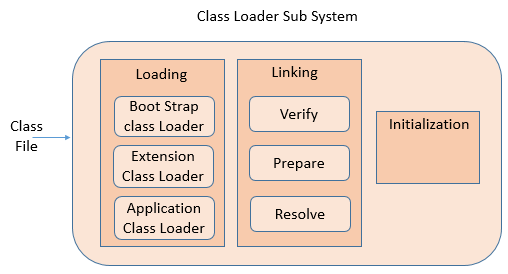
ClassLoader Subsystem
- Responsible for locating and importing the binary data for classes.
- Activities are performed in a strict order:
- Loading: finding and importing the binary data for a type
- Linking: performing verification, preparation, and (optionally) resolution
- Verification: ensuring the correctness of the imported type
- Preparation: allocating memory for class variables and initializing the memory to default values
- Resolution: transforming symbolic references from the type into direct references.
- Initialization: invoking Java code that initializes class variables to their proper starting values.
1. Loading
- Java run time system are independent of file systems because of classloaders.
- Java classes aren’t loaded into memory all at once, but when required by an application.
- Java ClassLoader is called by the JRE and these ClassLoaders load classes into memory dynamically.
A Java Classloader is of three types:
- BootStrap ClassLoader
- Primodial ClassLoader.
- loads classes from the location rt.jar.
- doesn’t have any parent ClassLoaders.
- A Bootstrap Classloader is a Machine code which kickstarts the operation when the JVM calls it.
- It is not a java class.
- Its job is to load the first pure Java ClassLoader.
- Primodial ClassLoader.
- Extension ClassLoader
- Child of Bootstrap ClassLoader
- Loads the extensions of core java classes from the respective JDK Extension library.
- It loads files from jre/lib/ext directory or any other directory pointed by the system property java.ext.dirs.
- Application ClassLoader
- System ClassLoader.
- child class of Extension ClassLoader.
- loads the Application type classes found in the environment variable CLASSPATH, -classpath or -cp command line option.
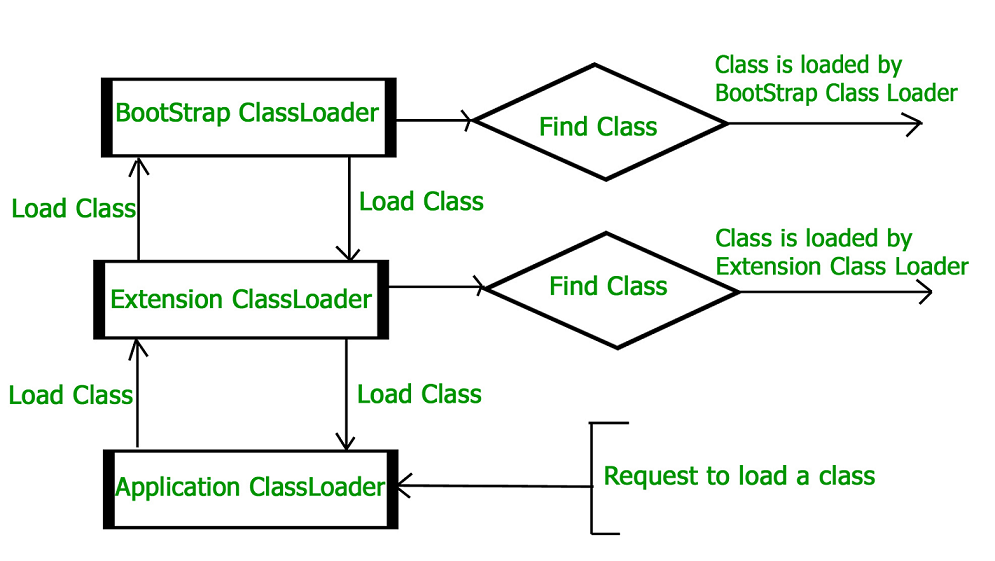
Classloader principles
- Delegation
- ClassLoader Delegation Hierarchy Model
Application ClassLoader --> Extension ClassLoader --> Bootstrap ClassLoader. - Bootstrap ClassLoader is always given the higher priority.
- ClassLoader Delegation Hierarchy Model
- Visibility
- Application classloader can see the classes loaded by the parent classloaders but not vice-versa.
- ClassNotFoundException at runtime.
- Uniqueness
- Class loaded by the parent classloader should not be again loaded by the child classloader.
Static vs Dynamic Class Loading
- Static class loading
- classes are statically loaded via the new operator.
- initializes the object after loading it.
- Dynamic class loading
- classes are programmatically loaded by using the Class.forName() or the loadClass() method.
- only loads the class but doesn’t initialize the object.
2. Linking
- performs the linking of a class or an interface.
- Involves the allocation of new data structures, it may throw the OutOfMemoryError.
- Performs the three important activities:
- Verification
- process of checking the binary representation of a class
- validating whether the generated .class file is valid or not.
- performed by the Bytecode verifier and if the generated .class file is not valid, a VerifyError is thrown.
- Preparation
- process of assigning the memory for the class level or interface level static variables and assigns the default values.
- Resolution
- process of changing the symbolic references with the original memory references from the method area.
- Verification
3. Initialization
- performs the final phase of the class loading.
- all the static variables are assigned the original values and the static blocks are executed from the parent to the child class.
- requires careful synchronization as JVM is multithreaded and some threads may try to initialize the same class or interface at the same time.
JIT Compiler
Read full article on JIT Compiler
- To improve the performance.
- Compiles parts of byte code having similar functionality at same time reducing compilation-time.
- Compiler here refers to translator for instruction sets of JVM to that of a specific CPU.
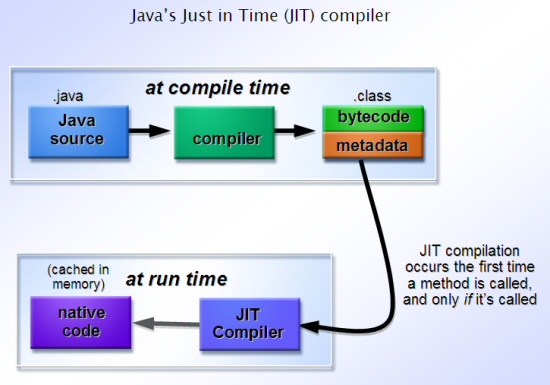
How Java Code Runs
JMM - Java Memory Model
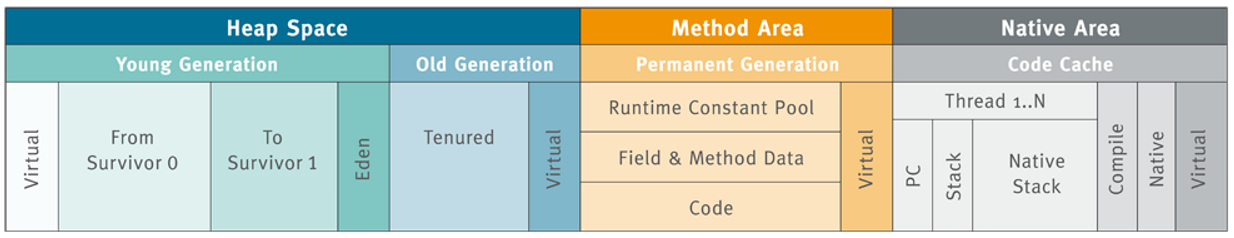
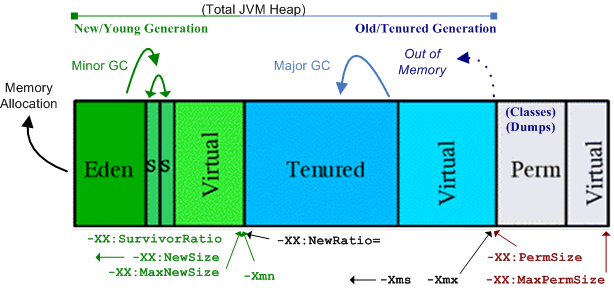
- JVM Heap memory is divided into two parts – Young Generation and Old Generation.
Young Generation
- Eden Memory and two Survivor Memory spaces (S0 and S1)
- Eden Memory
- Most of the newly created objects.
- Minor GC is performed when Eden space is filled and survivor objects are moved to S0.
- Minor GC also checks S0 and move them to S1.
- So, at a time one of the survivor space is always empty.
- Objects that survived after many cycles of GC, are moved to the Old generation memory space.
- A threshold is set for the age of the young generation objects to become eligible for promotion to Old generation.
Old Generation
- Contains objects that are long lived and survived after many rounds of Minor GC.
- Usually garbage collection is performed in Old Generation memory when it’s full.
- Old Generation Garbage Collection is called Major GC and usually takes longer time.
Stop the World Event
- All the Garbage Collections are “Stop the World” events as all application threads are stopped until operation completes.
- Minor GC is very fast and the application doesn’t get affected by this.
- Major GC takes longer time because it checks all the live objects, hence should be minimized.
- Duration taken by garbage collector depends on the strategy used for garbage collection.
- That’s why it’s necessary to monitor and tune the garbage collector to avoid timeouts in the highly responsive applications.
Perm Gen or Method Area
- Not a part of Java Heap memory.
- Populated by JVM at runtime based on the classes used by the application.
- contains Java SE library classes and methods.
- stores class structure (runtime constants and static variables) and code for methods and constructors.
- Perm Gen objects are garbage collected in a full garbage collection.
- Memory Pool
- Created by JVM memory managers to create a pool of immutable objects, if implementation supports it.
- String Pool is a good example of this kind of memory pool.
- Memory Pool can belong to Heap or Perm Gen, depending on the JVM memory manager implementation.
- Runtime Constant Pool
- Runtime constant pool is per-class runtime representation of constant pool in a class.
- It contains class runtime constants and static methods.
- Runtime constant pool is the part of method area.
- Java Stack Memory
- Java Stack memory is used for execution of a thread.
- contain method specific values that are short-lived and references to other objects on the heap referred from method.
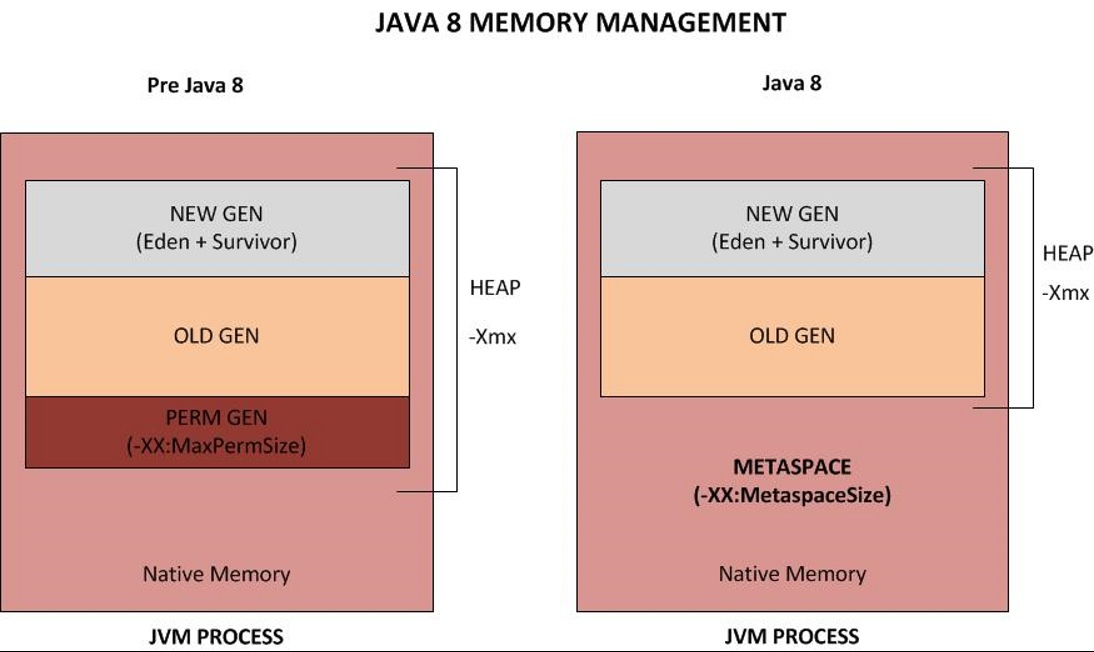
Where static variables are stored from Java 8
- Java 7
- static variables were stored in the permgen space.
- PermGen Space is also known as Method Area
- PermGen Space used to store 3 things
- Class level data (meta-data)
- interned strings(String Pool)
- static variables
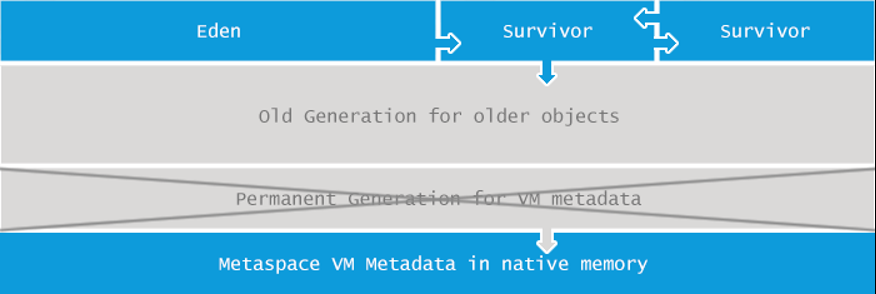
- From Java 8 onwards
- static variables are stored in the Heap itself.
- PermGen Space is removed and new space, MetaSpace is introduced which is not the part of Heap any more.
- MetaSpace is present on the native memory
- memory provided by the OS to a particular Application for its own usage
- MetaSpace - class meta-data and string pool
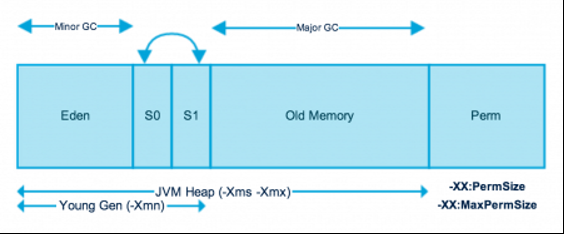
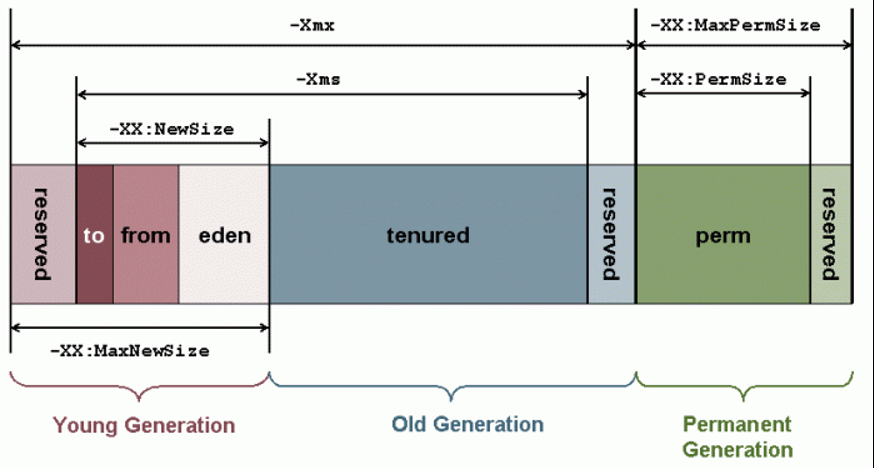
Java Heap Memory Switches
- Java provides a lot of memory switches that we can use to set the memory sizes and their ratios.
- Some of the commonly used memory switches are:
| VM SWITCH | VM SWITCH DESCRIPTION |
|---|---|
| -Xms | initial heap size when JVM starts |
| -Xmx | maximum heap size. |
| -Xmn | size of the Young Generation, rest of the space goes for Old Generation. |
| -XX:PermGen | initial size of the Permanent Generation memory |
| -XX:MaxPermGen | maximum size of Perm Gen |
| -XX:MetaspaceSize | |
| -XX:MaxMetaspaceSize | |
| -XX:SurvivorRatio | ratio of Eden space and Survivor Space Young Generation=10m with VM switch -XX:SurvivorRatio=2 then 5m will be reserved for Eden Space and 2.5m each for both the Survivor spaces. The default value is 8. |
| -XX:NewRatio | For providing ratio of old/new generation sizes. The default value is 2. |
| MinMetaspaceFreeRatio MaxMetaspaceFreeRatio | minimum percentage of class metadata capacity free after garbage collection |
Java Garbage Collection
- Process to identify and remove the unused objects from memory and free space.
- Java has automatic garbage collection.
- Garbage Collector, background program that looks unreferenced objects, which are deleted to reclaim memory.
- Garbage collection involves three steps:
- Marking – identifies objects not in use.
- Normal Deletion - removes the unused objects and reclaim the free space.
- Deletion with Compacting - For better performance, all survived objects moved together.
- Problems with simple mark and delete approach.
- Not efficient, because most of the newly created objects will become unused.
- Objects that are in-use for multiple garbage collection cycle are most likely to be in-use for future cycles too.
- Due to these problems, Java Garbage Collection is Generational.
- we have Young Generation and Old Generation spaces in the heap memory.
Garbage Collection Types
- Use JVM switch to enable the garbage collection strategy for the application.
- 5 types of garbage collection.
- Serial GC (-XX:+UseSerialGC)
- simple mark-sweep-compact approach for young and old generations garbage collection i.e Minor and Major GC.
- It is good for small applications with low memory footprint.
- useful in client-machines
- simple stand-alone applications
- machines with smaller CPU.
- Parallel GC (-XX:+UseParallelGC)
- Also called throughput collector because it uses multiple CPUs to speed up the GC performance.
- Same as Serial GC except that is spawns N threads for young generation garbage collection
- N is the number of CPU cores in the system.
- Parallel GC uses single thread for Old Generation garbage collection.
- We can control the number of threads using
-XX:ParallelGCThreads=nJVM option.
- Parallel Old GC (-XX:+UseParallelOldGC)
- same as Parallel GC, uses multiple threads for both Young Generation and Old Generation garbage collection.
- Concurrent Mark Sweep (CMS) Collector (-XX:+UseConcMarkSweepGC)
- known as concurrent low pause collector.
- does the garbage collection for Old generation.
- CMS collector tries to minimize the pauses due to garbage collection.
- by doing most of the garbage collection work concurrently with the application threads.
- CMS collector on young generation uses the same algorithm as that of the parallel GC.
- Suitable for responsive applications where we can’t afford longer pause times.
- Can limit the number of threads in CMS collector using
-XX:ParallelCMSThreads=nJVM option.
- G1 Garbage Collector (-XX:+UseG1GC)
- Garbage First or G1 garbage collector
- it’s long term goal is to replace the CMS collector.
- parallel, concurrent, and incrementally compacting low-pause garbage collector.
- G1 GC doesn’t work like other collectors and there is no concept of Young and Old generation space.
- It divides the heap space into multiple equal-sized heap regions.
- When a garbage collection is invoked, it first collects the region with lesser live data, hence “Garbage First”.
Reference Types
Types of references based on when will the objects on heap become eligible for garbage collection.
Strong Reference
- Not garbage collected if it has a direct or indirect strong reference pointing to it. (through a chain of strong references)
Weak Reference
- Object with weak reference is most likely to not survive after the next garbage collection process.
- A weak reference is created as follows:
WeakReference<StringBuilder> reference = new WeakReference<>(new StringBuilder());
- Use Case - caching scenarios where you retrieve some data, and you want it to be stored in memory but not sure when, or if, this data will be requested again. So, you can keep a weak reference to it, and in case the garbage collector runs, it could be that it destroys your object on the heap. Therefore, after a while, retrieve may return null value.
- A nice implementation for caching scenarios is the collection WeakHashMap<K,V>.
- Entry<K,V> actually extends the WeakReference class and uses its ref field as the map’s key:
// The entries in this hash table extend WeakReference, using its main ref field as the key.
private static class Entry<K,V> extends WeakReference<Object> implements Map.Entry<K,V> {
V value;        final int hash;        Entry<K,V> next;
- Once a key from the WeakHashMap is garbage collected, the entire entry is removed from the map.
Soft Reference
- For more memory-sensitive scenarios, Wll be garbage collected only when application is running low on memory.
- If no critical need to free up some space, the GC will not touch softly reachable objects.
- Java guarantees that all soft referenced objects are cleaned up before it throws an OutOfMemoryError.
- Similar to weak references, a soft reference is created as follows:
SoftReference<StringBuilder> reference = new SoftReference<>(new StringBuilder());
Phantom Reference
- Used to schedule post-mortem cleanup actions, since we know for sure that objects are no longer alive.
- Used only with a reference queue, since the get() method of such references will always return null.
- Garbage Collector adds a phantom reference to a reference queue after the finalize method of its referent is executed. It implies that the instance is still in the memory.
- Use Cases
- to determine when an object was removed from the memory which helps to schedule memory-sensitive tasks. For example, we can wait for a large object to be removed before loading another one.
- to avoid using the finalize method and improve the finalization process.
ReferenceQueue < Object > referenceQueue = new ReferenceQueue < > ();
List < LargeObjectFinalizer > references = new ArrayList < > ();
List < Object > largeObjects = new ArrayList < > ();

for (int i = 0; i < 10; ++i) {
    Object largeObject = new Object();
    largeObjects.add(largeObject);
    references.add(new LargeObjectFinalizer(largeObject, referenceQueue));
}
largeObjects = null;
System.gc();
Reference << ? > referenceFromQueue;
for (PhantomReference < Object > reference: references) {
    System.out.println(reference.isEnqueued());
}
while ((referenceFromQueue = referenceQueue.poll()) != null) {
    ((LargeObjectFinalizer) referenceFromQueue).finalizeResources();
    referenceFromQueue.clear();
}
public class LargeObjectFinalizer extends PhantomReference < Object > {
    public LargeObjectFinalizer(
        Object referent, ReferenceQueue << ? super Object > q) {
        super(referent, q);
    }
    public void finalizeResources() {
        // free resources
        System.out.println("clearing ...");
    }
}

// referenceQueue – to keep track of enqueued references, references – to perform cleaning work afterward, largeObjects – a large data structure.
- System.gc() isn’t triggering garbage collection immediately – it’s simply a hint for JVM to trigger the process.
- The for loop demonstrates how to make sure that all references are enqueued – it will print out true for each reference.
- Finally, we used a while loop to poll out the enqueued references and do cleaning work for each of them.
Garbage Collection Monitoring
- We can use Java command line as well as UI tools for monitoring garbage collection activities of an application.
~/Downloads/jdk1.7.0_55/demo/jfc/Java2D$ java -Xmx120m -Xms30m -Xmn10m -XX:PermSize=20m -XX:MaxPermSize=20m -XX:+UseSerialGC -jar Java2Demo.jar
jstat
- We can use jstat command line tool to monitor the JVM memory and garbage collection activities.
- It ships with standard JDK, so you don’t need to do anything else to get it.
- For executing jstat you need to know the process id of the application, you can get it easily using
ps -eaf | grep javacommand.
ps -eaf | grep Java2Demo.jar
501 9582  11579   0  9:48PM ttys000    0:21.66 /usr/bin/java -Xmx120m -Xms30m -Xmn10m -XX:PermSize=20m -XX:MaxPermSize=20m -XX:+UseG1GC -jar Java2Demo.jar
501 14073 14045   0  9:48PM ttys002    0:00.00 grep Java2Demo.jar
So the process id for my java application is 9582.
jstat -gc 9582 1000
| S0C | S1C | S0U | S1U | EC | EU | OC | OU | PC | PU | YGC | YGCT | FGC | FGCT | GCT |
|---|---|---|---|---|---|---|---|---|---|---|---|---|---|---|
| 1024.0 | 1024.0 | 0.0 | 0.0 | 8192.0 | 7933.3 | 42108.0 | 23401.3 | 20480.0 | 19990.9 | 157 | 0.274 | 40 | 1.381 | 1.654 |
| 1024.0 | 1024.0 | 0.0 | 0.0 | 8192.0 | 8026.5 | 42108.0 | 23401.3 | 20480.0 | 19990.9 | 157 | 0.274 | 40 | 1.381 | 1.654 |
| 1024.0 | 1024.0 | 0.0 | 0.0 | 8192.0 | 8030.0 | 42108.0 | 23401.3 | 20480.0 | 19990.9 | 157 | 0.274 | 40 | 1.381 | 1.654 |
| 1024.0 | 1024.0 | 0.0 | 0.0 | 8192.0 | 8122.2 | 42108.0 | 23401.3 | 20480.0 | 19990.9 | 157 | 0.274 | 40 | 1.381 | 1.654 |
| 1024.0 | 1024.0 | 0.0 | 0.0 | 8192.0 | 8171.2 | 42108.0 | 23401.3 | 20480.0 | 19990.9 | 157 | 0.274 | 40 | 1.381 | 1.654 |
| 1024.0 | 1024.0 | 48.7 | 0.0 | 8192.0 | 106.7 | 42108.0 | 23401.3 | 20480.0 | 19990.9 | 158 | 0.275 | 40 | 1.381 | 1.656 |
| 1024.0 | 1024.0 | 48.7 | 0.0 | 8192.0 | 145.8 | 42108.0 | 23401.3 | 20480.0 | 19990.9 | 158 | 0.275 | 40 | 1.381 | 1.656 |
The last argument for jstat is the time interval between each output, so it will print memory and garbage collection data every 1 second.
Let’s go through each of the columns one by one.
- S0C and S1C: current size of the Survivor0 and Survivor1 areas in KB.
- S0U and S1U: current usage of the Survivor0 and Survivor1 areas in KB. Notice that one of the survivor areas are empty all the time.
- EC and EU: current size and usage of Eden space in KB. Note that EU size is increasing and as soon as it crosses the EC, Minor GC is called and EU size is decreased.
- OC and OU: current size and current usage of Old generation in KB.
- PC and PU: current size and current usage of Perm Gen in KB.
- YGC and YGCT: YGC column displays the number of GC event occurred in young generation. YGCT column displays the accumulated time for GC operations for Young generation. Notice that both of them are increased in the same row where EU value is dropped because of minor GC.
- FGC and FGCT: FGC column displays the number of Full GC event occurred. FGCT column displays the accumulated time for Full GC operations. Notice that Full GC time is too high when compared to young generation GC timings.
- GCT: This column displays the total accumulated time for GC operations. It’s sum of YGCT and FGCT column values.
- The advantage of jstat is that it can be executed in remote servers too where we don’t have GUI.
- Notice that sum of S0C, S1C and EC is 10m as specified through -Xmn10m JVM option.
Java VisualVM with Visual GC
- If you want to see memory and GC operations in GUI, then you can use jvisualvm tool.
- Java VisualVM is also part of JDK, so you don’t need to download it separately. Just run jvisualvm command in the terminal to launch the Java VisualVM application. Once launched, you need to install Visual GC plugin from Tools –> Plugins option.
Java Garbage Collection Tuning
- Java Garbage Collection Tuning should be the last option you should use for increasing the throughput of your application and only when you see drop in performance because of longer GC timings causing application timeout.
- If you see java.lang.OutOfMemoryError: PermGen space errors in logs, then try to monitor and increase the Perm Gen memory space using -XX:PermGen and -XX:MaxPermGen JVM options.
- You might also try using -XX:+CMSClassUnloadingEnabled and check how it’s performing with CMS Garbage collector.
- If you see a lot of Full GC operations, then you should try increasing Old generation memory space.
- Overall garbage collection tuning takes a lot of effort and time and there is no hard and fast rule for that. You would need to try different options and compare them to find out the best one suitable for your application.
OutOfMemoryError - memory leaks
Have you faced OutOfMemoryError in Java? How did you solved that?
- Allowed limit of memory for java application is specified during application startup.
- Heap space and Permgen (for Permanent Generation)
- subclass of java.lang.VirtualMachineError and JVM throws java.lang.OutOfMemoryError when it ran out of memory in heap.
- Two Types of OutOfMemoryError in Java:
- Java.lang.OutOfMemoryError: Java heap space : export JVM_ARGS=”-Xms1024m -Xmx1024m”
- Java.lang.OutOfMemoryError: PermGen space : export JVM_ARGS=”-XX:PermSize=64M -XX:MaxPermSize=256m” Now, Perm Gen is not there and moved to heap as metaSpace so no more option 2.
Long Term Solution:
- Short Term Solution
- Increasing the Start/Max Heap size
- changing Garbage Collection options.
- increased Java heap space also increase the length of GC pauses affecting your application’s throughput or latency.
- Best approach
- Understand the memory needs of your program
- ensure memory is used wisely and does not have leaks.
- You can use a Java memory profiler to determine what methods in your program are allocating large number of objects and then determine if there is a way to make sure they are no longer referenced, or to not allocate them in the first place.
What is causing it?
- The application just requires more Java heap space than available to it to operate normally.
- Memory Footprint – Runtime memory requirements.
- Spikes in usage/data volume: Application recieves spikes of volume of data beyond expected threshold it is designed to handle.
- Memory leaks: A particular type of programming error will lead your application to constantly consume more memory. Every time the leaking functionality of the application is used it leaves some objects behind into the Java heap space.
Example of memory leak
below code does not contain a proper equals() implementation next to its hashCode() hence causes continuous creation of new objects for Key.
public static void main(String[] args) {
    Map m = new HashMap();
    while (true)
        for (int i = 0; i < 10000; i++)
            if (!m.containsKey(new Key(i)))
              m.put(new Key(i), "Number:" + i);
}
@Override
public boolean equals(Object o) {
   boolean response = false;
   if (o instanceof Key) {
      response = (((Key)o).id).equals(this.id);
   }
   return response;
}
To solve, you need to figure out which part of your code is responsible for allocating the most memory.
- Which objects occupy large portions of heap
- Where these objects are being allocated in source code
Process outline that will help you answer the above questions:
- Get security clearance in order to perform a heap dump from your JVM.
- “Dumps” are basically snapshot of heap contents that you can analyze.
- These snapshots can thus contain confidential information, such as passwords, credit card numbers etc, so acquiring such a dump might not even be possible for security reasons.
- Get the dump at the right moment. Be prepared to get a few dumps, as when taken at a wrong time, heap dumps contain a significant amount of noise and can be practically useless. On the other hand, every heap dump “freezes” the JVM entirely, so don’t take too many of them or your end users start facing performance issues.
- Find a machine that can load the dump. When your JVM-to-troubleshoot uses for example 8GB of heap, you need a machine with more than 8GB to be able to analyze heap contents.
- Fire up dump analysis software.
- Detect the paths to GC roots of the biggest consumers of heap.
- Next, you need to figure out where in your source code the potentially hazardous large number of objects is being allocated. If you have good knowledge of your application’s source code, you’ll be able to do this in a couple searches.